Finance chart
Loan Payment Chart
Use this loan payment chart to compare common loan amounts, terms, and estimated monthly payments.
Last updated: May 2026
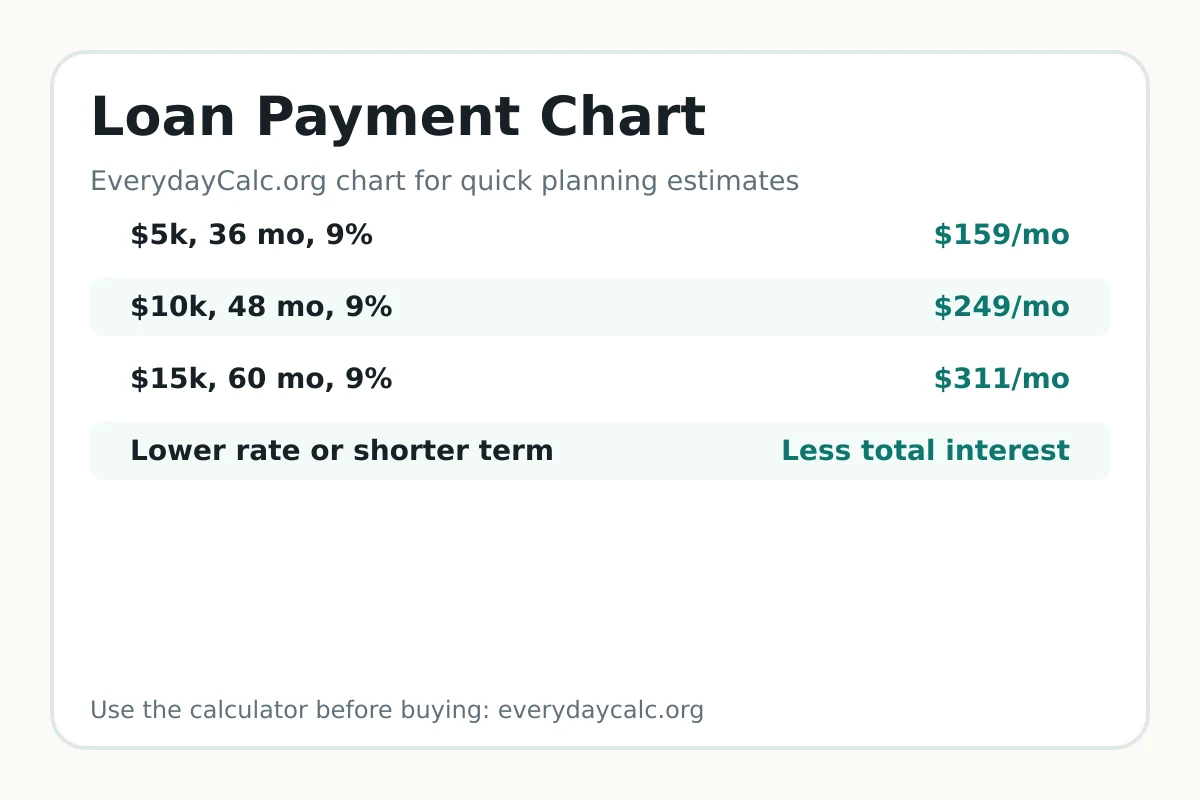
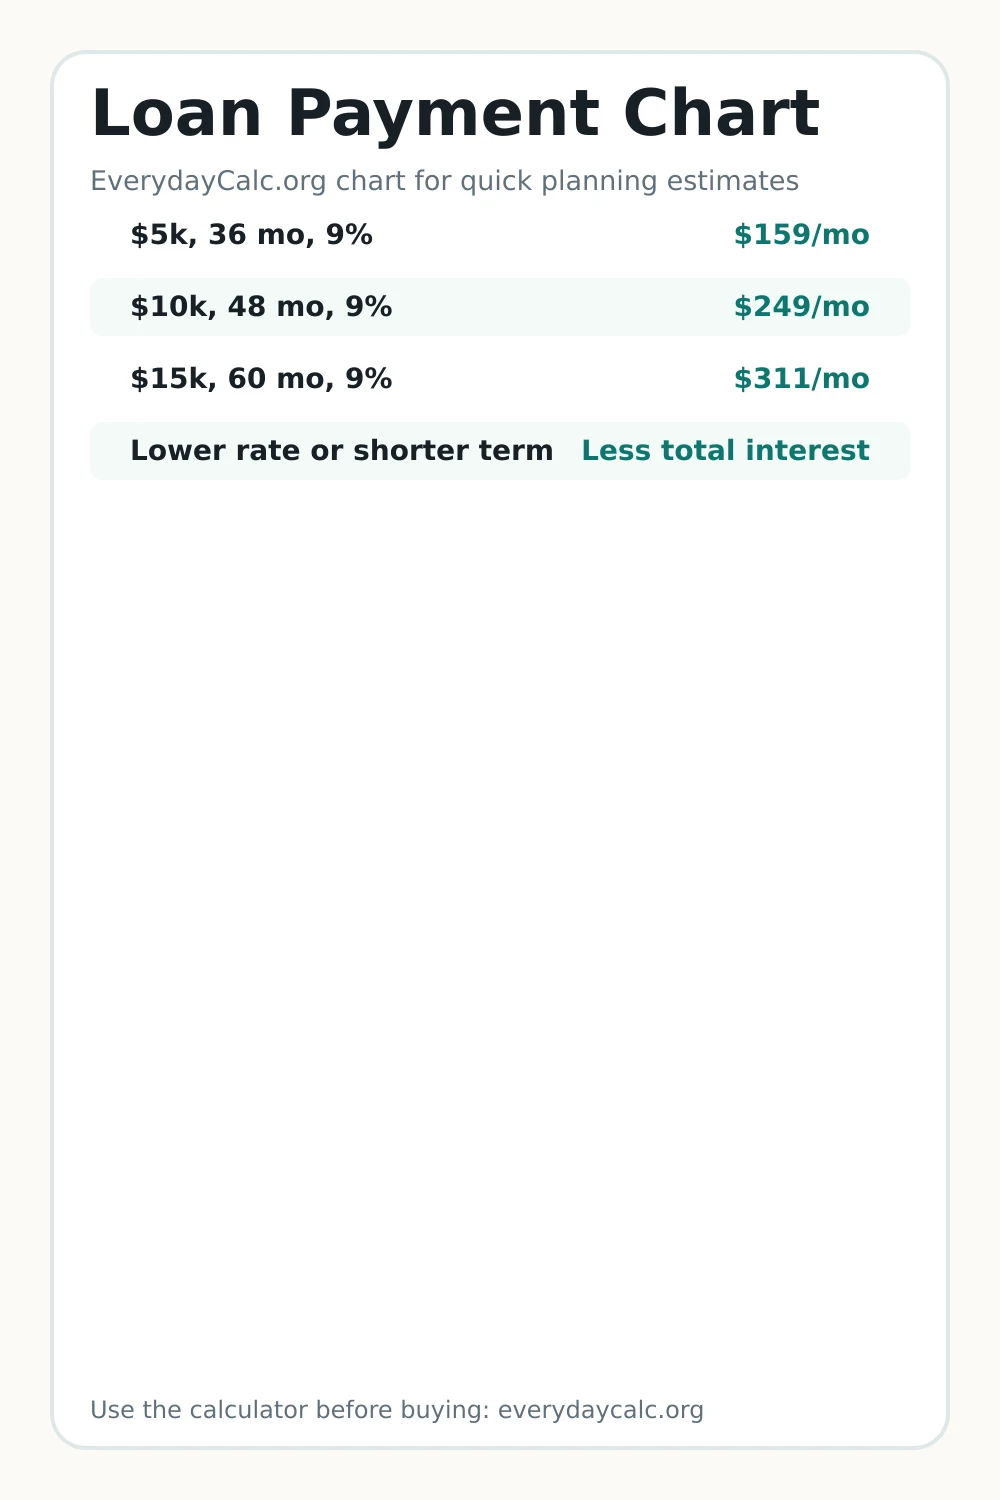
Chart values
| $5k, 36 mo, 9% | $159/mo |
|---|---|
| $10k, 48 mo, 9% | $249/mo |
| $15k, 60 mo, 9% | $311/mo |
| Lower rate or shorter term | Less total interest |